Interpreting Manhattan GMAT Assessment Reports
Looking for advice on evaluating your practice exams? Be sure to check out this article too.
First Steps
If you are just beginning to look into the GMAT, we recommend reading through The GMAT Uncovered before continuing. The same information can be obtained by attending our in-person or Live Online GMAT Open House Sessions. You can read more about these programs here.
If you feel like you have a good understanding of the exam, then it’s time to take a practice test! Until you’ve taken a full practice GMAT, there’s no way of knowing exactly how much you need to prepare for the exam. Fortunately, ManahttanGMAT makes this easy by offering a free computer adaptive exam that will serve as a useful diagnostic tool. Before you continue to structure your prep program, it is important to take a full exam. Additionally, in the scope of your business school application, it’s important to know the average GMAT score of the schools you are applying to. Here is a list of the top business school programs and their associated GMAT scores to get you started.
After Your Practice Exam
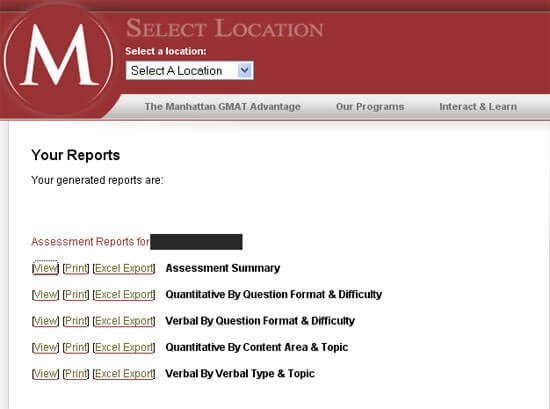
You may have noticed in the Student Center the option View Assessment Reports just above the table containing your CAT test. Click on this option and under the Include column on the table below, select your recently finished practice exam and click on Generate. You’ll be directed to a screen that looks like this:
Assessment Summary
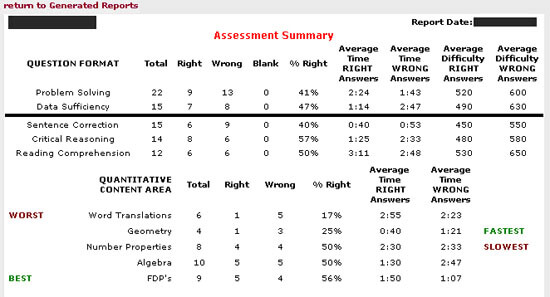
The Assessment Summary Window offers you a good general overview of your performance on the practice test, providing you a breakdown of your performance for all question formats on the exam. You’ll immediately notice a few details on these reports.
First, if you average the results in the % Right column together, the quant average and the verbal average will roughly equal 50%. If you recall the slides from the Understanding the GMAT section, you will remember that this is due to the computer adaptive nature of the exam and will generally be true for all the tests you take, regardless of your final score! On the real GMAT, you are expected to get up to 40-50% of your questions incorrect, even if you’re performing relatively well.
Second, you should compare the average time spent on wrong answers to the time spent on correct answers. Ideally, these numbers will be roughly comparable. Spending far too long on problems you get wrong could indicate that you are getting stuck and wasting time on problems you don’t know how to solve. Conversely, if the times on problems you got wrong are very low, then you might be making careless mistakes or giving up too early on problems that you might be able to solve.
It is important to keep in mind that regardless of the final score, the average time for both right and wrong questions should be roughly 2 minutes for each question on the quant section and 1 minute, 45 seconds for each question on the verbal section. If your average time is above this threshold, then you are most likely not getting to every question on the exam and need to speed up. If your average time is below this threshold, then you are speeding through the section; slowing down a bit can help you achieve a higher difficulty level of questions.
Quantitative/Verbal by Question Format and Difficulty
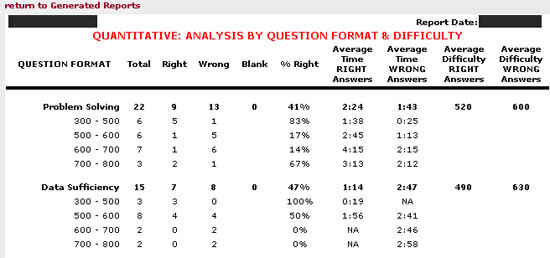
The Quantitative Analysis section of your report will organize the information by difficulty according to question format. Hence, you will be able to see the number of questions you received by difficulty level. Here are some details about how to interpret this information:
Look in the column indicating the total number of questions you answered. The difficulty level containing the greatest number of total questions is a good indicator of the level at which you are testing. For example, the student above answered 8 Data Sufficiency questions in the 500 “ 600 range, meaning that he or she would score roughly in this range on a real GMAT exam. However, the picture may not be so clear-cut as. Even within the same student profile, looking at his problem solving breakdown, you should see that he or she excels at the easiest and most difficult questions, but fails to correctly answer the questions in the 500 “ 700 point range. This pattern may indicate that the student falls for various traps in problems that seem easy but are actually quite difficult. The fact that the average time for wrong answers is lower than the average time for right answers suggests confidence in the incorrect answers, further highlighting the likelihood of falling for traps.
It is also important to note that you should read the %Right column differently for this subsection of your assessment. Generally, going from lowest difficulty level to highest, the %Right column should decline from a high number to a low number. In the Data Sufficiency section, for example, the %Right declines from 100% to 0%. This indicates that the student hits a wall at the 500-600 level questions and cannot get past these difficult problems; as a result, the %Right for harder questions is 0%. However, this is not all bad news, since the “foundation” is solid “ the student got every 300-500 level problem correct. In contrast, looking at the student’s responses to the Problem Solving section, you’ll see a more inconsistent range of percentiles, indicating a shaky foundation of content understanding.
Finally, the average time spent on questions according to difficulty level can be an extremely revealing indicator of how well you know the material. Generally, while the time spent on each question should still roughly equal 2 minutes in the quant section and 1 minute, 45 seconds in the verbal section, a slight progression from fastest time to slowest time with respect to increasing difficulty level is normal. As you can tell from this student’s problem solving section, this progression appears to be the case, albeit the timing is not ideal “ the average time for correct questions at the 500-600 level or above exceeds 2 minutes by 45 seconds or more.
Compare this with the student’s performance on the Data Sufficiency section. He or she answered all 3 questions correctly in the lowest difficulty level in an average of just 19 seconds! After that, the time spent on a correct question lengthens to 2 minutes, and then he or she doesn’t get any right after that. Quick and correct questions to easy questions and long, incorrect responses to harder questions indicate that the student has not yet come up with a process for tackling this section of the exam. If the process were in place, you would see more uniformity within the results.
Quantitative/Verbal By Content Type & Topic
Because you have only completed one practice exam, this part of your assessment report will not provide you with concrete results. In a class, after you have completed roughly 3 exams, this section details your performance on individual question types across the quant and verbal sections.